Raise Your Content Marketing Game with These 114 Content Marketing Stats
Content marketing touches a broad scope of channels, comes in many different styles and serves a variety of purposes but at its core, content marketing is no different than any other form of marketing – its purpose is to use content to reach an audience/group of customers.
However, even with content marketing being seemingly simple at its core, there are endless ways to execute it and areas to allocate time and resources to. With so many options, it’s easy to get stuck, not sure of what route to take. Or, you may do the opposite and try to advance in too many areas of content marketing – leading to you mastering none.
This piece is designed to compile helpful content marketing stats that will guide you through the endless options and give you a glimpse into what is working for the rest of the content marketing world. Without further ado, 114 Content Marketing Stats That Will Guide You to Success:
SEMrush’s The State of Content Marketing Global Report
This report released by SEMrush is exactly what we were looking for when putting together this list. It’s focus is to help “content marketers across the globe gain a better understanding of their industry and draw more relevant conclusions for their strategies.”
The way they put together this report is quite unique and not your typical survey-style study. They “analyzed 450,000+ tweets, hundreds of thousands of search queries, 700,000+ blog posts, and surveyed 1,200+ marketers across the globe” to cultivate useful data for the report. Let’s take a look at some of the more interesting content marketing stats from the report.
1-5: Most Popular Themes/Topics Discussed in Tweets Using #ContentMarketing in 2019
Ever wonder what’s the most talked about topics in the content marketing world ? It’s a good thing to know because it is a reflection of what’s trending and what’s important to other pros.
The content marketing stats below came from “topics (key themes) that were discussed in the most popular tweets (20+ retweets) that were published between January and September 2019 and contained #ContentMarketing.” Below are the most discussed topics:
Strategy: 29%
Social Media: 11%
SEO: 10%
Statistics: 5%
AI, Blogging, Content Ideas and Tools: Tied with 4%
6-12: Most Popular Types of Visuals and Link Usage in Tweets Using #ContentMarketing in 2019
Similar to the last section, this is focused on popular tweets that included #ContentMarketing, but in this section the report is looking at what style of content is used IE the presence of visual content and links.
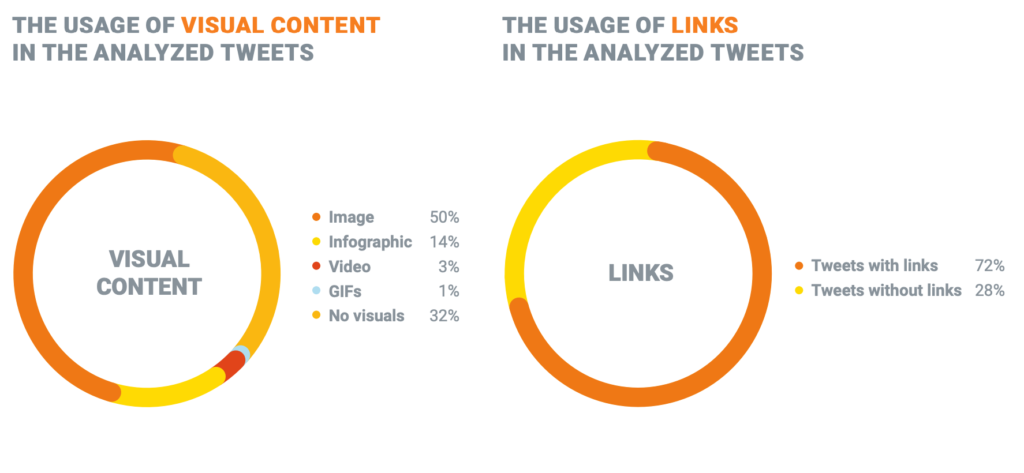
Image: 50%
No Visuals: 32%
Infographic: 14%
Video: 3%
GIFs: 1%
Tweets with Links: 72%
Tweets Without Links: 28%
HubSpot’s Not Another State of Marketing Report 2020
HubSpot has been one of the leading sources for content marketing stats and info for many years now. This particular report looks at “trends and data from over 3,400 global marketers plus progressive strategies from our experts and partners.” Below we look at a number of questions they asked these marketers with the hope that this data will help give you insight into what is working for others.
13-17: How Important is Content Marketing to Your Overall Marketing Strategy?
Very Important: 38%
Moderately Important: 25%
Extremely Important: 23%
Slightly Important: 13%
Not at All Important: 3%
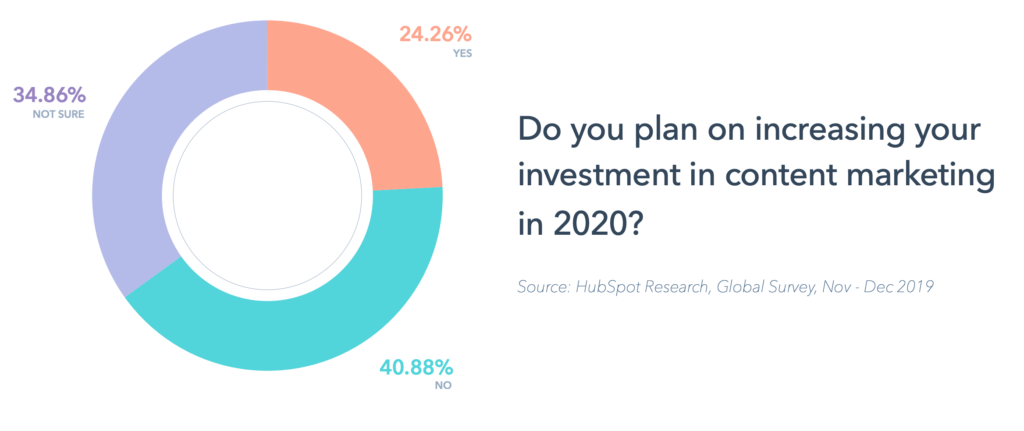
18: Will You Be Increasing Your Investment in Content Marketing?
Despite 61% of the marketers surveyed stating that content marketing is very to extremely important, only 24% of marketers said that they will be increasing their investment in content marketing in 2020. This tells us that these marketers are either happy with their ROI, can’t convince upper management to invest more resources into it or don’t care to do so themselves.
19-25: How Do You Measure the Success of Your Content Marketing Strategy?
If you ever wondered what other marketers feel the most important measurement of their content marketing success is, the below content marketing stats will give you a look. Their answers most likely reflect what channels they are allocating the most resources to.
Sales: 23%
Web Traffic: 17%
Lead Generation: 16%
Social Engagement: 15%
Onsite Engagement: 14%
SEO Success: 11%
Authority: 4%
26-30: How Many Audience Segments Are You Creating Content For?
It’s important to personalize your content, but how many audience segments is the sweet spot? Take a look at these content marketing stats for answers.
3 Segments: 37%
2 Segments: 23%
5 Segments: 21%
1 Segments: 12%
4 Segments: 9%
31-38: What Are the Primary Forms of Media Used Within Your Content Strategy?
Looking for content ideas or having trouble deciding what the best style of content to go with is? Here is a look at what other marketers are focused on.
Videos: 19%
Blogs: 16%
eBooks: 16%
Infographics: 14%
Case Studies: 13%
Interviews: 11%
White Papers: 9%
Checklists: 8%
39-43: What Type of Videos Are You Investing In?
With video being the #1 form of media being used, you might be wondering what types of videos other marketers are investing in.
Product or Service Promotion: 24%
Brand Storytelling: 23%
Product Demos: 18%
Social Engagement: 17%
Customer Case Studies: 16%
44-48: What Channels Are You Creating Content For?
Looking past types of content, it’s maybe more important to find the right channels to focus on. What is the focus of other marketers?
Facebook: 29%
Company Website: 19%
Instagram: 17%
YouTube: 16%
LinkedIn: 14%
49-55: What Content Marketing Metrics Are You Tracking?
Below are more content marketing stats that give a glimpse into what other marketers find important.
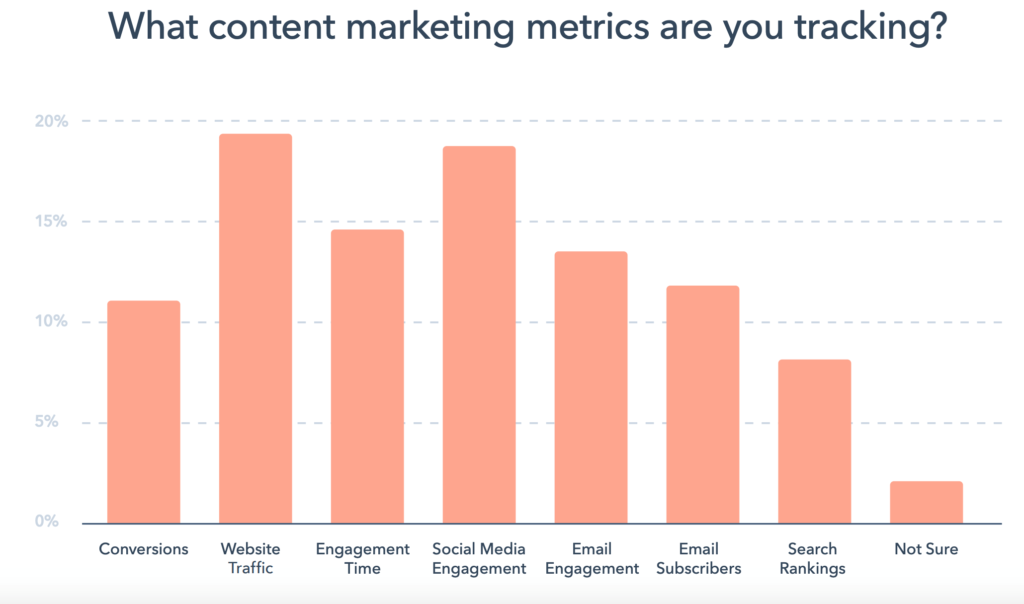
Website Traffic: 19%
Social Media Engagement: 18%
Engagement Time: 14%
Email Engagement: 13%
Email Subscribers: 12%
Conversions: 11%
Search Rankings: 7%
2020 B2B Benchmarks, Budgets, and Trends – North America
This study is presented by the Content Marketing Institute and MarketingProfs. For marketers in the B2B space, this is an excellent report. The criteria for respondents in the report is you work at a “for-profit company in North America, primarily selling products/services to businesses (B2B), your organization has used content marketing for at least one year and you are a content marketer, involved with the content marketing function, and/or someone to whom content marketers report to.”
56-62: Top Technologies B2B Organizations Use to Assist with Content Marketing
With so many tools and technologies out there, it’s hard to figure out which ones are the most effective.
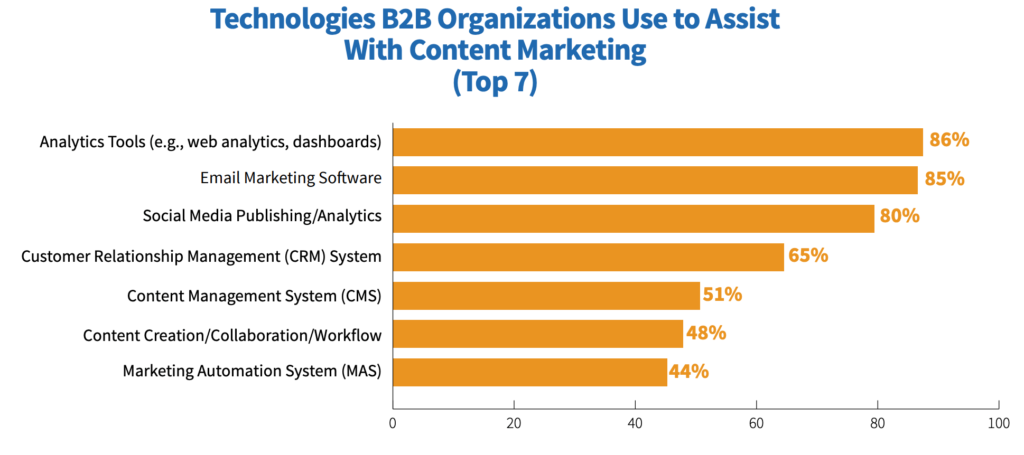
Analytics Tools (e.g., web analytics, dashboards): 86%
Email Marketing Software: 85%
Social Media Publishing/Analytics: 80%
Customer Relationship Management (CRM) System: 65%
Content Management System (CMS): 51%
Content Creation/Collaboration/Workflow: 48%
Marketing Automation System (MAS): 44%
63-67: B2B Organizations’ Content Marketing Team Structure
If you’re a head or leader of your marketing department, you may have wondered how other leaders have structured their teams.
We have a small (or one-person) marketing/content marketing team serving the entire organization: 52%
We have a centralized content marketing group that works with multiple brands/products/departments throughout the organization: 25%
Both—We have a centralized group and individual teams throughout the organization: 15%
Each brand/product/department has its own content marketing team: 6%
Other: 2%
68-69: Does Your B2B Organization Outsource Any Content Marketing Activities?
If you’ve ever thought about outsourcing your content marketing activities, you’re not alone. However, quite a few have decided against it as well.
Yes: 50%
No: 50%
70-76: What Content Marketing Activities Are B2B Organizations Most Likely to Outsource?
If you are considering outsourcing, these content marketing stats show the areas other organizations are outsourcing for.
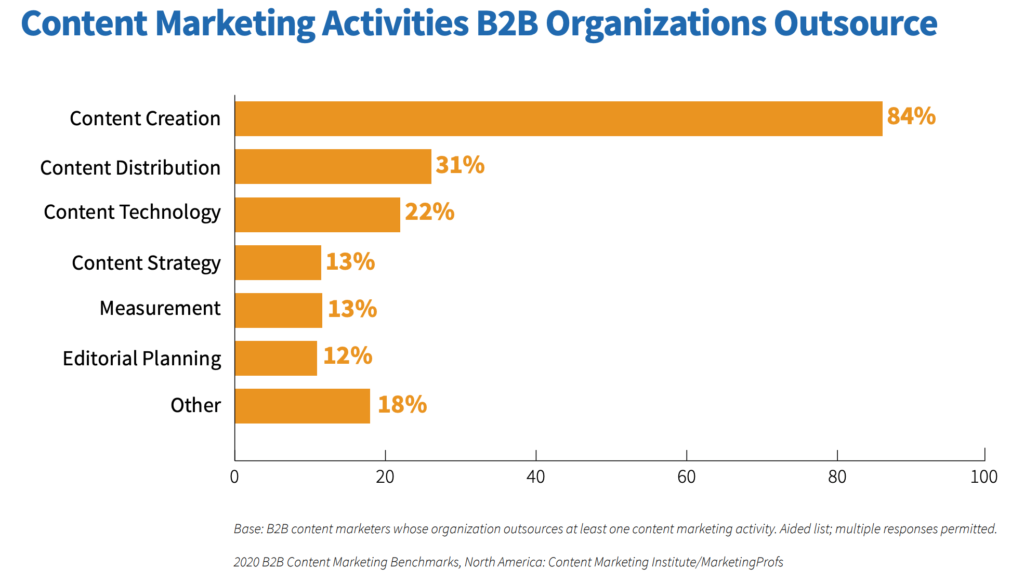
Content Creation: 84%
Content Distribution: 31%
Content Technology: 22%
Content Strategy: 13%
Measurement: 13%
Editorial Planning: 12%
Other: 18%
77-81: Percentage of Total Content B2B Marketers Created for Content Marketing Purposes in Last 12 Months
It can be tricky figuring out what stage of the sales funnel is the most important stage to create content for.
Top-of-the-funnel (generating awareness/interest): 50%
Mid-funnel (consideration/intent): 22%
Late-stage (evaluation/purchase): 14%
Post-sale (loyalty/brand advocacy): 11%
Other areas: 3%
82-88: Paid Content Distribution Channels B2B Marketers Used in Last 12 Months
Sometimes in content marketing, organic gets all the focus, but it’s important to consider paid channels as well.
Social Media Advertising/Promoted Posts: 72%
Sponsorships (e.g., booths, workshops, branding): 66%
Search Engine Marketing (SEM)/Pay-Per-Click: 61%
Banner Ads Promoting Your Content (e.g., ebook, webinar): 46%
Partner Emails Promoting Your Content (e.g., ebook, webinar): 32%
Native Advertising/Sponsored Content (not including social media platforms): 31%
Other: 14%
B2C Content Marketing 2020: Benchmarks, Budgets, and Trends
This study is also presented by the Content Marketing Institute and MarketingProfs but focuses on B2C content marketing benchmarks and trends. Their criteria for respondents are the same as its B2B counterpart (for-profit company, used content marketing for at least one year and they themselves are in involved in B2C content marketing in some capacity).
89-95: Content Marketing Activities B2C Organizations Outsource
Comparing the B2C respondents to B2B organizations, you see a drop in content creation being outsourced but an uptick in all other categories.
Content Creation: 80%
Content Distribution: 37%
Content Technology: 27%
Content Strategy: 16%
Measurement: 14%
Editorial Planning: 14%
Other: 20%
96-100: Percentage of Total Content B2C Marketers Created for Content Marketing Purposes in Last 12 Months
Once again looking at the comparison between B2C and B2B, you see a drop in content created for the top and middle of the funnel but an uptick in content created for the late stage and post-sale areas.
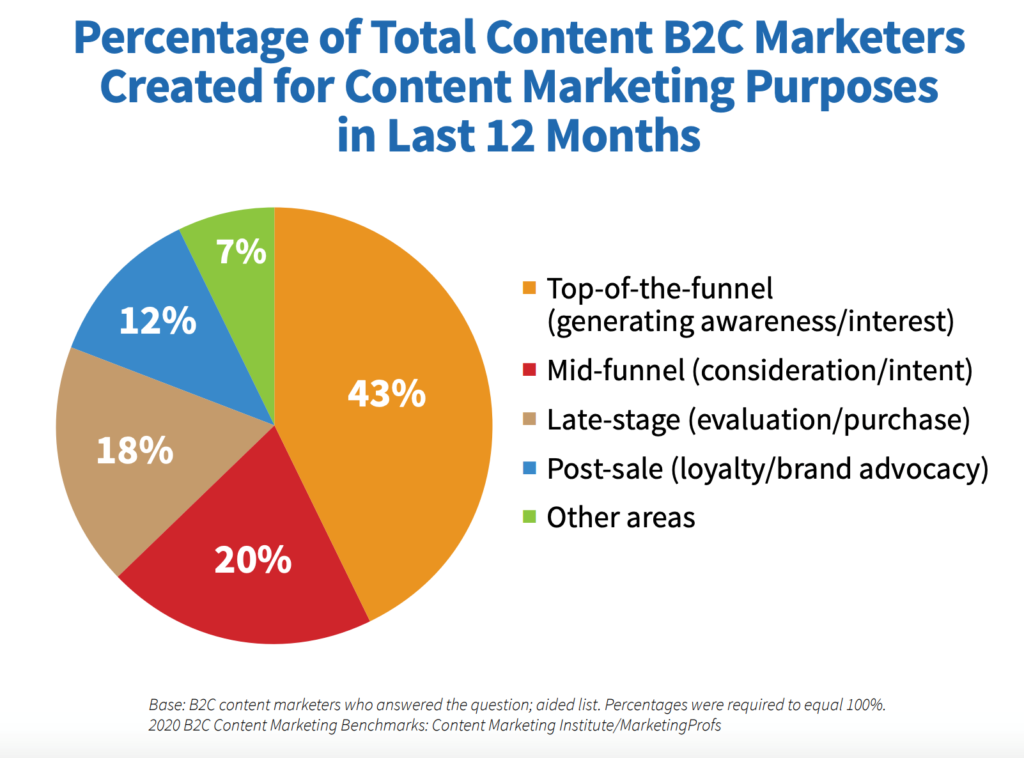
Top-of-the-funnel (generating awareness/interest): 43%
Mid-funnel (consideration/intent): 20%
Late-stage (evaluation/purchase): 18%
Post-sale (loyalty/brand advocacy): 12%
Other areas: 7%
101-107: Paid Content Distribution Channels B2C Marketers Used in Last 12 Months
Here we have social media, SEM, banner ads, and native advertising going up while partner emails and sponsorships went down in usage.
Social Media Advertising/Promoted Posts: 89%
Search Engine Marketing (SEM)/Pay-Per-Click: 68%
Banner Ads Promoting Your Content (e.g., ebook, webinar): 50%
Sponsorships (e.g., booths, workshops, branding): 44%
Native Advertising/Sponsored Content (not including social media platforms): 40%
Partner Emails Promoting Your Content (e.g., ebook, webinar): 25%
Other: 19%
108-114: Organic Content Distribution Channels B2C Marketers Used in Last 12 Months
Looking back at the organic side, these content marketing stats show what the most used B2C organic content distribution channels are.
Social Media Platforms: 93%
Their Organization’s Website/Blog: 85%
Email: 79%
Media/Influencer Relations: 39%
Speaking/Events: 37%
Guest Posts/Articles in Third-Party Publications: 31%
Other: 11%
There you have it, folks! We hope that our 114 Content Marketing Stats That Will Guide You to Success will come in handy when planning your own content marketing strategies, ideas and more!


